Content:
The International Conference on Marine Data Management and Information Systems IMDIS2008 was held in Zappeion Conference Centre of Athens (Greece) from March 31 to April 2, 2008, jointly organized by the SeaDataNet Consortium, the Intergovernmental Oceanographic Commission of Unesco (IOC/IODE) and the Hellenic Centre for Marine Research.
More than 200 participants met to get an up-to-date overview of present information systems on marine environmental data, and to show the progresses on development of efficient infrastructures for managing large and diverse data sets.
The Conference has brought forward different systems for on-line access to data, meta-data and products, communication standards, adapted technologies, and interoperable platforms. Information systems have an increasing role in the society and a strong impact on science, technology and business. There are trends in software, hardware and telecommunication networks for managing information, moving to access to products through services. The fundamental principle defined during the Conference is that data should be a public good. The implication is that it is necessary to provide quality services to end users.
The Conference allowed to map out and analyze the major information systems so as to identify improvement and requirements for improved systems. Mission of the existing data network is to facilitate a long term and sustainable access to interoperable, high quality data necessary to understand the geological, biological, chemical and physical behavior of the seas and oceans.
Due to the diverse technologies and methodologies, interoperability has been defined as one of the priorities, in order to ease the user access to different kind of products in oceanography, fishery, biology, geology. A key element for this and an equal priority is the development of common vocabularies and conventions. Also education has been considered during the Conference as an important issue to be taken into account in all programs.
IMDIS 2008 has represented the agora for the different communities working on information systems. It has created collaborative links and understandings of common problems.
The Conference programme and all presentations are available at:
http://hnodc.hcmr.gr/imdis-2008/
Training and capacity building is an important component of the SeaDataNet
project necessary for successful development of the project. The project
training program has two main objectives:
- To ensure that the data and meta-data to be integrated in the SeaDataNet
system will be formatted, checked for quality and disseminated according to the
common protocols developed in the project Joint Research Activity. Therefore
staff of data centres will be instructed and trained in common formats, common
procedures, and the application of common software tools.
- To build capacity in several data centres not yet equipped with the
appropriate inter-comparable data management facilities. This is organised by
developing and providing portable data management tools and thereafter
instructing and training IT experts of the data centres in the basics,
installation and operation of these technical components of the SeaDataNet
infrastructure. This will support achieving a consistent and operational
SeaDataNet network configuration.
The third SeaDataNet Training Course was held from 16th till 19th June 2008
and it focused on the first objective. The theme of the training course was
From data collection to the SeaDataNet data management system, thereby going
into details about:
- Data management procedures to follow for SeaDataNet
- Reformatting data from their observation format to the common SeaDataNet
Transport formats
- Quality control
- Generation of metadata following the new V1 metadata formats and using the
Common Vocabularies.
Central in the training course was transferring information and training
hands-on experience in the upgrading of the Version 0 formats and tools to the
new Version 1 formats and tools. V1 formats and ISO 19115 XML schema's have
recently become available for EDMED, EDMERP, CDI and CSR, while upgraded tools
are now also available for entry, maintenance, retrieval, and validation of
these V1 metadatabases (MIKADO software, online Content Management Systems, Web
services, Common Vocabularies, and XML Validation services) and
for analysing and presenting data (new ODV Beta version) following the also
recently defined SeaDataNet Transport formats.
The training was
composed of several lectures and hands on exercises that were done by trainees
on the dedicated PCs using their own example data sets or test datasets provided
by the trainers.The training has been provided by experts and taskleaders from
Ifremer (France), BODC (UK), AWI (Germany), HCMR (Greece), MARIS (The
Netherlands), and BSH (Germany). Trainees from nearly all 35 partner countries
have participated.
The training was organized and hosted by the IOC-IODE
(IOC International Oceanographic Data and Information Exchange Programme) that
is responsible for this project activity and that has a great experience in the
oceanographic data management trainings. The training was held at the IOC
Project Office for IODE (Ostend, Belgium) that has all necessary equipment and
facilities. Each trainee had a possibility to use a training Pc or his/her own
laptop connected to the broadband Internet and to the training
server.
The training programme and the associated presentations and
courses are available at:
http://www.seadatanet.org/education/training_courses/third_training_course/lectures
General description
SeaDataNet has developed ISO-19115 based XML formats for the catalogues managed in the project: cruise summary reports (CSR), marine environmental data sets (EDMED), marine environmental research projects (EDMERP), common data index (CDI), European directory of the ocean-observing System (EDIOS).
Common vocabularies have also been set up for marking up entries to these catalogues and to make sure that all partners use standards for meta-data and communication.
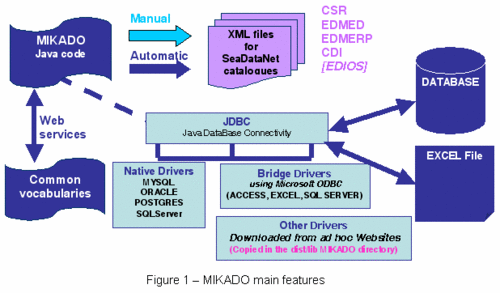
The MIKADO software tool has been designed to support SeaDataNet partners in generating standard catalogue entries. MIKADO is an XML catalogue description generator used to create XML files for metadata exchange of CSR, EDMED, CDI, EDMERP and EDIOS. MIKADO can be used into 2 different ways :
- In a manual way, to input manually information for catalogues in order to generate XML files.
- In an automatic way, to generate these descriptions automatically if information is catalogued in a relational database or in an Excel file. Automatic way is needed for those who have many entries referenced in a relational database, and should be used in most case for the CDI XML descriptions. CDI describes data sets, originating from individual observations, managed at Data Centres and for most Data Centres this can cover several thousands to hundreds of thousands of CDI XML entries.
Java Data Base Connectivity (JDBC) drivers are delivered with MIKADO for the main RDBMS (Relational Data Base Management System) (Figure 1)
MIKADO is written in Java Language which means that it is available under multiple environments (Windows 2000, XP, VISTA), Apple, Unix (Solaris) and Linux.
MIKADO uses the SeaDataNet common vocabularies web services to update lists of values which are then uploaded locally. That means that MIKADO needs network connections in order to have up to date lists of values, but can be used offline once the lists are up-to-date.
MIKADO development
MIKADO version 1.3 has been demonstrated and tested during the SeaDataNet training course organised at the IODE headquarters of Oostende (Belgium) in June 16-19 2008.
Version 1.4 with correction of the bugs detected during the training course has been delivered and is freely available and can be downloaded from:
http://www.seadatanet.org/news__1/mikado_v1_4_available
The downloadable zip file also includes the User Manual. A dedicated presentation of the features and working of the new MIKADO tool can be found at the webpage of the Third Training Course (see previous article).
Note: the current version does not yet generate EDIOS XML descriptions. This will be available later on when the EDIOS XML schema has been finalised.
MIKADO helpdesk
When using MIKADO questions and errors must be reported to: sdn-userdesk@ifremer.fr
The subject of the mail should be MIKADO question or MIKADO error.
The SeaDataNet Virtual Ocean Data Centre is a distributed infrastructure that provides transnational access to marine data, meta-data, products and services through 40 interconnected Trans National Data Access Platforms (TAP) from 35 countries around the Black Sea, Mediterranean, North East Atlantic, North Sea, Baltic and Arctic regions
This newsletter is presenting some of the Data Centres of the SeaDataNet network.
- The Marine Institute's information system - Ireland
- The Cyprus Oceanographic Data Centre - Cyprus
- The IMS-METU National Oceanographic Information Center - Turkey
The new Marine Institute Integrated Mapping Observation page uses the Microsoft Virtual Earth Mapping interface to access real time readings from sensors and instruments managed by the Marine Institute http://www.marine.ie/home/publicationsdata/data/IMOS

INFOMAR Seabed Survey Data
The INFOMAR programme is a joint venture between the Geological Survey of Ireland and the Marine Institute and is the successor to the Irish National Seabed Survey. Covering some 125,000 square kilometres of underwater territory, INFOMAR (the INtegrated Mapping FOr the Sustainable Development of Irelands MARine Resource) project will produce integrated mapping products covering the physical, chemical and biological features of the seabed.
Data is available for download without charge through the Interactive Web Data
Delivery System at http://www.infomar.ie/.
The Irish Spatial Data Exchange
Overview
The Irish Spatial Data Exchange (ISDE) will allow distributed data discovery across organisations. It allows the discovery of marine spatial data across multiple organisations using a single point of entry.
Project Aim
The proliferation of 3rd party metadata can cause large maintenance overheads and inaccuracies. ISDE also allows each organisation to retain control over their data and metadata by querying each organisations own data catalogues. This ensures that users are always searching the most up-to-date information.
ISDE will allow a user to search for spatial data across multiple organisations from any partners website. Currently marine spatial data in Ireland is held across a number of organisations e.g. oceanographic data with the Marine Institute, INFOMAR seabed survey data with the Geological Survey Ireland (GSI). ISDE will make it easier for end users to discover and ultimately view and obtain the data they want.
Architecture
ISDE is a multi-tier mediation system, consisting of a ISDE Browser providing the search user interface, a middle-tier consisting of a broker and mediator, and a backend catalogue interface wrapper. Partners will continue to use their existing CSW-compliant data catalogues. A hosting option is also planned to support organisations who would prefer not to host their own catalogue.

Standards
ISDE is based on the OGC standard ISO 19115/19119 application profile for CS-W 2.0.2. It will allow participating organisations to achieve INSPIRE Discovery Level 1 compliance.

Status
The system is currently entered final testing and will be integrated into existing partners websites over the next few months. The current partners are the Marine Institute, the Geological Survey Ireland, the Department of Communications, Energy and Natural Resources, the Coastal and Marine Resource Centre in UCC and the Environment Protection Agency.
More details and a prototype demonstration system is available at www.isde.ie.
SmartBay - The Next Generation of Advanced Coastal and Marine Monitoring and Management
SmartBay Galway is a new research infrastructure project which will comprise of a network of seafloor cables, buoys and other infrastructure, supporting a range of sensors, information systems, telemetry and other communication technologies.
As part of SmartBay Galway programme the Marine Institute and IBM are engaged in a multiyear collaboration to develop and provide advanced capabilities for global water management solutions.
The collaboration consists of four innovative projects
- Development of the next generation of integrated cyberphysical environments for Sensors in marine environmental monitoring and management
- An Integrated data and information environment with innovative human interface and advanced visualization capabilities supporting multi-disciplinary users in marine environmental monitoring and management
- Advanced device monitoring and management for remote Sensors and data collection/aggregation platforms
- Real-time distributed stream analytical fabric for marine environmental monitoring and management
SmartBay Web Portal
The SmartBay Portal is an integrated data/information environment and portal solution demonstrator using existing sensor data feeds will be developed to support multiple diverse users including
- Industry/seafood sales (fishing and aquaculture)
- General public/water quality
- Public policy
- Research
A federated data environment will be implemented to support large volumes of heterogeneous data and multiple user requirements, including
- Sensor-based data (including real-time/streaming)
- Syndicated data sources (including weather)
- Large scale modeling and simulation data
- Geospatial information (GIS)
New advanced visualization technologies and capabilities will be developed and implemented for very large and complex data sets
- To improve usability
- To visualize uncertainty
Some details are currently available at http://www.marine.ie/home/services/rnd/oceanenergymarinetechnology/SmartBay.htm with more to follow shortly.
New and upcoming developments in BYTHOS: Cyprus Oceanographic Data Centre, Oceanography Center, University of Cyprus (www.oceanography.ucy.ac.cy)
In 2005 the Cyprus Oceanography Centre at the University of Cyprus began to explore new possibilities for visualization and management of oceanographic data. The initial efforts led to the development of the Cyprus Climatological Database-CyCliDB, which enable the browsing and downloading of archived in-situ data of the Mediterranean and Black Seas. Later on and since the aims and the capabilities of the CyCliDB changed, in order to implement common standards and procedures within EU projects, such as SeaSearch and SeaDataNet, the CyCliDB renamed to Bythos; a Greek word which in English means profundity.
The aim of Bythos is to provide a rich internet application which enables oceanographers to visualize their data online. Initially, the Bythos was destined for the CyODC (Cyprus Oceanographic Data Centre) but later on it was extended in order to support data provided by other centers. The front-end of Bythos is totally based on Flex 2. Yahoo! The backend was initially based on PHP5/Oracle XE but unfortunately due to capacity limitation the backend is now based on MySQL. The communication between front-end and backend is achieved through XML.
The next big challenge is to support multiple repositories through a single user interface. Ideally, each oceanographic centre will host its data while the front-end will be responsible for retrieving and combining these data. These will hopefully be supported by version 2.0 of Bythos.
Features of Bythos v1.0
Capabilities
The Bythos was developed in order to allow users to search on-line the database based on the type, name and date of the available cruises and view the results on a map. Such results include the stations comprising a cruise, its route as well as metadata regarding the cruise. Profiles are also available which are created dynamically and may include information regarding temperature, oxygen, salinity etc. In addition, the provided information may be downloaded either for individual stations or for the whole cruise. However it is important to state here that Bythos is a web based environment which means it is accessible through the internet, and therefore cannot be downloaded on your laptop for offline use.
Infrastructure
From the beginning of Bythos development, the content and presentation layer were strictly separated. As a consequence, the presentation layer (user interface) is not aware of the actions performed by the content layer (server) or in general how it operates. This allows for strong in-dependency between the two layers. For example the presentation layer can easily be changed without changing the content layer at all. In fact, the two layers are only aware of a predetermined communication protocol. This protocol is comprised by XML exchanges, a technique that increases the level of abstraction since the same layer may be used by other presentation layers as well. The presentation layer makes a request for data and the content layer responses with the appropriate data.
The content layer is located on the web server and it is responsible for importing, storing and finally providing data to the presentation layer. Data files, which are in MEDATLAS format, were imported into an Oracle XE database - a freely available, lightweight database from ORACLE with up to 4GB storage (MEDATLAS database is up 1GB). The scripts responsible for import were written in PHP 5. It is worth mentioning that despite the total changes made to the user interface only slight changes were made to content layer which is a benefit derived from the strict layer separation.
On the other side, the presentation layer is located on the users computer and it is responsible for making requests, receiving data and finally visualizing them in variant ways. The presentation layer was initially built in HTML, later it was transformed to Flash and today is totally based on Flex. Finally, the maps are provided by Yahoo! Maps a free web service by Yahoo!
New Features in Bythos v1.1
The features demonstrated by version 1.0 of Bythos created new requirements for its further development. These requirements resulted in the development of a newer version, the Bythos v1.1.
Database
Capacity limitations in Oracle XE (4GB) made it impossible to continue using it and therefore the data needed to be transferred back to MySQL which was used initially in CyCliDB.
Search for Data
The search functionality in Byhtos v1.1 has been expanded and now the user has the opportunity to search for cruises that include a variety of data types and parameters, such as Bathythermograph, CTD station as well as nitrate, oxygen etc. The ability to search for specific months remains the same as in version 1.0.
The search functionality also enables the user to search for cruises and oceanographic data in a specific region.
In addition the Bythos v1.1 gives the opportunity to the user to move back and forth between the screens of the search wizard and consequently make changes to any previous selections. If for example the user has chosen to plot the data of a single cruise and now needs to compare it with another cruise, the user can move back to the second step of the search wizard and select the desired second cruise. Both cruises with be plot together on the same map.
Data Visualization
Another great functionality provided by Bythosv1.1 is the ability to plot/visualize more than one cruise on the map at the same time.
When a cruise is plotted on the map and the user has selected to view its route, a line connects the various stations comprising the cruise. However this line begins with light color and continues with darker shades of red. This is done in order to provide a clear visualization of both the beginning and the end of the cruise.
Bythos v1.1 provides a Marks and a Mark it functionality. The first enables the user to access a previously saved search while the latter enables the user to conduct a search and save it for future reference.

Another functionality in Bythos v1.1, is Regions which can be accessed through the menu and which enables the user to browse to a specific region and perform any search from that area. The regions available in the list are predefined.
When a user has completed a search and the route of a cruise is plotted on the map, profiles and metadata can be viewed by clicking on a station. However, what is new in Bythos v1.1 is that by holding down the shift key on the keyboard and clicking on different stations you can view a combined profile for the selected stations.
Future work
Despite the great effort to meet all functional requirements in Bythos, advances in technology require continuous development in order to create systems that are both efficient and effective and which meet all the high scientific standards. For this purpose, we are continuously expanding our requirements list.
The main requirements of a new version include being able to support the visualization of data from other data centers. Each centre will provide Bythos with its data that will ideally be taken either through FTP/HTTP directories, OpenDAP or from a local directory. The NetCDF data format should be supported. Bythos v2.0 should provide a customized interface according to the needs of each data provider. In addition, an offline version of Bythos should also exist in order to cover the needs of oceanographers during field campaigns. Moreover, these new features will benefit end users coming from with different backgrounds other than oceanography, such as fishermen who are proven to be in need of the oceanographic forecasts in their everyday activities.
Maps
Yahoo! Maps currently used by Bythos offer an excellent visualization tool. However Yahoo! Maps are not suitable for rendering advanced plots such as horizontal maps. This is due to the rendering methodology and the lack of support to custom overlays. A customized overlay mechanism could be developed but this requires great effort since we are not familiar with the way Yahoo! Maps work internally. As an alternative solution to this, we suggest the use of vector maps, used in earlier version of Bythos (CycliDB). Vector maps are fully scalable and most importantly do not rely on or require internet connection. Therefore, the same maps could be used for the offline version of Bythos. Last but not least, we will be able to provide custom overlays for horizontal maps (even arrows).

Data Visualization
A basic requirement for the upcoming version is the need for provision of profiles for the whole cruise and not just for single or multiple stations that comprise a cruise. Furthermore there is a need to visualize multiple cruises through the use of different colors that help the users eye capture the visualized information more easily.
Authentication and Access
For covering the needs of other data providers, access to Bythos should be given. This will be achieved through ACL (Access Control List) which will be implemented in order to manage privileges from different data centers. More specifically, Bythos should provide a central authentication initially and afterwards a local authentication for the supported data centers.
UI Customization
As mentioned earlier, the User Interface should be customized in order to meet the needs of different data providers. In particular, the providers name, logo and URL should change automatically. A dedicated name should also be given to the database hosting each providers data.
 The Institute of Marine Sciences (IMS) is located on the Mediterranean
coast, near Erdemli, west of the town of Mersin. It is a part of the Middle East
Technical University (METU), one of the leading universities in Turkey, which
has its main campus in Ankara. IMS was established in 1975 with the objectives
of conducting oceanographic research and providing graduate level education in
marine sciences with special emphasis given to studying the national marine
environment, developing and improving the marine resources of Turkey.
The Institute of Marine Sciences (IMS) is located on the Mediterranean
coast, near Erdemli, west of the town of Mersin. It is a part of the Middle East
Technical University (METU), one of the leading universities in Turkey, which
has its main campus in Ankara. IMS was established in 1975 with the objectives
of conducting oceanographic research and providing graduate level education in
marine sciences with special emphasis given to studying the national marine
environment, developing and improving the marine resources of Turkey.
The Institute has four main divisions:
 Chemical Oceanography
Marine Biology and Fisheries
Marine Geology
and Geophysics
Physical Oceanography
The Institutes campus at Erdemli
houses office buildings, laboratories, library, computing and remote sensing
facilities, atmospheric tower for conducting aerosol measurements, and 3
research vessels in the institute harbour.
Data
Services
IMS METU hosts the National Oceanographic Information
Center (NOIC), which is coordinated by the National Oceanographic Data
Management Committee (NODMC). NOIC manages two main databases:
- The Black Sea Regional Historical Inter-Disciplinary Database, which have
been set up in framework of the two large regional scientific projects supported
by NATO. These projects brought together efforts of scientists from all main
institutes of riparian countries as well as international institutes dealing
with the Black Sea. As a result the comprehensive quality controlled database
has been created, which includes data on 152 variables at more than 29,000
oceanographic stations for period since 1956 with extensive datasets for
1973-1994.
After the period of limited use the database is now freely
accessible online at the internet address http://sfp1.ims.metu.edu.tr/ODBMSDB/.
 The National Oceanographic Data Inventory, which is set up to manage
metadata about research cruises carried out by Turkish marine organizations. The
inventory contains information about basic oceanographic data collected at more
than 30,000 oceanographic stations (transects) in period between 1960 and
present. The metadata are collected from following disciplines:
The National Oceanographic Data Inventory, which is set up to manage
metadata about research cruises carried out by Turkish marine organizations. The
inventory contains information about basic oceanographic data collected at more
than 30,000 oceanographic stations (transects) in period between 1960 and
present. The metadata are collected from following disciplines:
- Physical oceanography;
- Chemical oceanography;
- Marine biology;
- Marine meteorology;
- Marine pollution;
- Fisheries;
- Geology and Geophysics.
Metadata received from Turkish
organizations are checked, transformed to unified format and included into the
web-based application to provide public access to the information. The internet
address of the inventory is: http://www.ims.metu.edu.tr/inventory.


